


Rainier and Liberty Cap Temperature and Elevation Measurements

Ascending in the morning near Ingraham flats
Aug 20, 2026
Eric Gilbertson, Olly Cohen, Greg Scruggs, Alex Canizaro
Results:
-Rainier summit had 29 days above freezing June 13 – Aug 20 (42% of days were above freezing)
-255 hours were above freezing (16% of time)
-Max summit temp 41F, Aug 6
-Min summit temp 9F, June 27
-Mean summit temp 25F
-Columbia Crest melted down 1.3ft relative to late Aug 2025, and melting is accelerating
-Liberty Cap now has 3ft-4ft tall angled penitentes on summit
-Columbia Crest is projected to melt to rock within 20 years
-Liberty Cap will no longer be an icecapped peak within 20 years

The route
Introduction
There have historically been five icecapped peaks in the contiguous US, all in Washington State. They were Rainier, Liberty Cap, Eldorado, Colfax, and East Fury. They have gradually been melting down over the past few decades due to global warming, and three now have rock summits. East Fury changed to a rock summit in 1990, Rainier in 2014, and Eldorado in 2020. Currently Liberty Cap and Colfax are the last two remaining icecapped peaks in the contiguous US.
I’ve been measuring these peaks twice a year at minimum snow depth time in late summer and maximum snow depth time in mid spring since 2024. Even though Rainier is no longer an icecapped peak, the former ice summit, Columbia Crest, still exists, though it is no longer the highest point on the mountain. I’m continuing to survey Columbia Crest and Liberty Cap to track changes. This year I additionally wanted to gather temperature data on the summit of Rainier.
I have previously collaborated with climatologist Dr. John Abatzoglou and glaciologist Dr. Scott Hotaling to model degree days above freezing on Mt Rainier, and we modeled that the summit is indeed getting above freezing, and the degree days above freezing have been increasing since around the year 2000 (see our scientific paper https://www.tandfonline.com/doi/full/10.1080/15230430.2025.2572898 ). The synchronous increase in summit temperatures with decrease in summit elevation has led us to the conclusion that the elevation loss is due to melting.
However, the temperature on the summit has never been directly measured. I’ve heard USGS has attempted to install a weather station on the summit in the past, but it did not survive the harsh conditions. The closest weather station to the summit is at Camp Muir around 10,000ft, with near-continuous operations since 2015 (link to temperature data from camp muir: https://waterdata.morageology.com/station.php?g=OSOMUR ).
The weather model most trusted by the park for summit temperatures is the UW Mount Rainier Recreation Forecast (accessed here: https://a.atmos.washington.edu/data/rainier_report.html). The forecast is not saved by UW (I’ve asked), but I’ve saved the forecast daily for over a year with help coding from Peter Steele. In summer 2025 there were 35 days with forecast freezing levels above the summit level, meaning forecast above-freezing days on the summit. This was consistent with our modeling. But it is still not a direct measurement, so is not conclusive.
In order to prove our hypothesis that the elevation loss is due to melting, there would really need to be direct temperature measurements on the summit. In late spring Mt Rainier National Park gave me permission to install a few small temporary temperature loggers on the summit. My hope was they would be small enough, hidden under rocks, to survive the harsh conditions.

Hiking up at sunrise
I was still concerned about them being stolen or vandalized, like the summit monuments have been, but with multiple loggers hidden in different locations I could minimize that risk. On June 13th I climbed up the Emmons route with Peter Steele and Thomas Coleman and placed the loggers at an elevation of 14,200ft near the summit. (I couldn’t place them directly on the summit since people would likely find them there). The loggers can only transmit data short distances over bluetooth, so I would have to physically return to get data off of them. This, however, allows them to be very efficient with their small batteries. They just log data once per hour and only transmit if a button is pressed, and have a nominal 13-year battery life. This also allows them to be small enough to hide out of sight.
Measurements
By late August it was time to return for elevation measurements and to log temperature data. Olly, Greg, and Alex were available to join. We originally planned to climb on Friday Aug 21, but the forecast had high winds and precip, so we shifted to Thursday Aug 20. The day before, Wednesday, I drove to Paradise by mid afternoon and picked up the climbing permit. The ranger told me the DC route was still in good shape, and this was consistent with the climbing ranger blog post from a few days earlier. We all made it there by the evening and took a nap in the overnight lot.

Nice sunrise
By midnight Thursday morning we started up. We hit snow just after crossing Pebble Creek, and cramponed up to Camp Muir by 4am. From there we roped up, crossed the Cowlitz Glacier, then hiked over the rock of Cathedral Gap to Ingraham Flat. We then hiked up over high crack by sunrise and approached the Disappointment Cleaver. By then a group of about 20 climbers was descending.

Hiking up through the penitentes
This seemed like an odd time to descend. It appeared to be a big guided group from RMI split into teams of three, with one guide and two clients per rope team. The first guide told us they bailed at a sketchy crevasse crossing at 12,900ft that had an ice plug that didn’t look too strong. The client said it would likely melt out by afternoon and was too dangerous and there was no way around it.
I was skeptical, though, that it was actually impassable. A guide will generally be super conservative, and would have incentive to exaggerate the risk to clients to persuade them to turn around. Then the client would have incentive to exaggerate the risk to another group to justify that they turned around. It’s actually pretty common for me climbing Rainier to encounter groups turning around because they say the conditions are too sketchy, when in reality the route is safe and fine and I make the summit no problem.

More penitentes
Higher up another guide simply said the route is out and there was a gaping impassable crevasse. I didn’t really believe that. There’s almost always a way through a crevasse maze. I’ve sometimes rapped into a crevasse and ice climbed out the other side to get past.
We finally made it past all the descending climbers, hustled through the bowling ally, then unroped and scrambled up the cleaver. One other guide and client were descending and they said they didn’t even get to the sketchy part. They just assumed it was too dangerous and turned around. Near the top of the cleaver two independent climbers turned around, also not having reached the sketchy part. They said they just assumed it was too dangerous. I kind of wonder how many people actually inspected the location, or if it was just one person’s opinion that turned around 20+climbers.

Mounting the first receiver on the SW rim summit
Above the cleaver we roped back up and followed the nice trench through the penitentes. Interestingly, when I first climbed Rainier in 2007 in late August there were no penitentes at all, but they are now a common occurrence on the mountain late summer.
We zig zagged up to around 12,900ft, then found where all the fresh tracks stopped. There was indeed a snow bridge across a crevasse there, but it looked perfectly safe to me and would certainly last through the day. There were also options to climbers left to get around it on another bridge if needed. I had recently gotten back from Peru climbing Huascaran and had crossed dozens of snow bridges way sketchier than that one. As usual, it was a good call to inspect the situation first hand rather than trust what the bailing climbers said.

The second receiver on Columbia Crest
We crossed no problem and continued up the route. From there we traversed right to the Emmons Shoulder, then zig zagged back up. By 10:45am we reached the southeast rim, then unroped and I carried the equipment over to the summit. I mounted a Trimble DA2 on the SW Rim highpoint boulder at 11am and started logging data. I usually bring a 2m antenna rod to get the greatest possible sky view, but that day was windy enough that it would have knocked it over (forecast winds 25mph). So I instead mounted it on a 1.0ft antenna rod. That was still a very accurate setup capable of errors less than 0.1ft.

Heading to Liberty Cap
I took Abney level angular measurements down to Columbia Crest, then moved over to Columbia Crest and mounted another DA2 on a 1.0ft antenna rod and mini tripod. I then took Abney level measurements up to the SW Rim. This would give me additional relative height measurements to corroborate the GNSS measurements.

Crossing the bergschrund
Interestingly, Columbia Crest had changed significantly since last year. Last year it was white rime/snice on top, and for the first time a crevasse had formed over the summit in a SE-NW direction. This year the summit was melted down to grey glacier ice and a second crevasse had formed perpendicular the first going almost directly over the summit. It appears Columbia Crest is being ripped apart.
Also, now there were a dozen 10-lb rocks half melted out near the top. I have never seen rocks on Columbia Crest and am very curious how they got there. They are obviously natural since some are still partially frozen in. It appears the crater rim must have been much higher in the past, so the rocks could fall off it onto Columbia Crest.

Tricky measuring conditions on Liberty Cap summit
Perhaps shortly after Rainier last erupted (the larger eruption ~1000 year ago), Columbia Crest started forming, and the western crater rim was much higher. When Columbia Crest got to its current height it was still below the western crater rim, but maybe rocks eroded down the rim. Perhaps then Columbia Crest kept building higher as the rim then eroded down to it’s current height.

Descending the DC route
After starting the data logging at 11:30am Olly and I continued on to Liberty Cap while Greg and Alex stayed to guard the equipment. Though, it seemed unlikely we would see any other climbers with the guides telling everyone the route was out. We descended to the Liberty Cap – Rainier col, and conditions were much more challenging than in the past summers. Deep penitentes and sun cups made progress slow. On the last ridge up to Liberty Cap I poked through a crevasse at one point, but I quickly rolled out. Then we had to cut onto the east face to find a snow bridge across the upper bergschrund. We put running pro in for that.

Nice sunset
Finally by 1:30pm we reached the summit, and it was very different this year. In 2024 it had been smooth snow, and in 2025, it had 2ft penitentes with gaps in between. Now it was covered in dense 3-4ft tall angled penitentes. It was challenging to identify where the summit was and where to mount the DA2. Top of highest penitente? Bottom of highest penitente? I ended up mounting it on the highest penitente that would support it without falling over, then tape measured down to the base. I would report the elevation as a range instead of one value.

Sunset descending the cleaver
By 2pm I logged the data, then we returned. It was just as challenging going back, and we finally reached the SW Rim by 4pm. I logged the data there, then logged the data on Columbia Crest. We then located the hidden temperature loggers and I logged the data from all of those.
By 5pm we started down. This was excellent timing, since the upper DC route was now in the shade and starting to ice up again. We made fast time down, and interestingly saw two other climbers just above 13,000ft on their way up. They were RMI guides fixing up the route in preparation for more guided climbs the next day. The descending guides must have alerted them that the route needed some work.

Comparison of Columbia Crest in 1999 (left) and 2026 (right)
This was excellent news for us, and they did a great job fixing up the route. Down lower they had installed a ladder across the crevasse where the guided groups had bailed. It was fun to cross and we got some good pictures there. We soon made it back to the cleaver, and then off the bottom by sunset. We then hiked back to Camp Muir and back down to Paradise by 1am for a 25hr push.

Columbia Crest elevations over time
Results
Elevation
I processed the data the next day and found the SW Rim is the same elevation as before within error bounds, 14,406.2ft +/-0.1ft NAVD88. This elevation has now been recognized by Rainier National Park as the true elevation of Rainier, as published in an opinion piece in the scientific journal Arctic, Antarctic, and Alpine Research on June 15 this year (Beason 2026).

Measured location of ground (black line) beneath Columbia Crest
Note: I am now reporting elevations in the current US datum, NAVD88. The park still uses the old datum, NGVD29, for all its signs that say 14410ft, the pre-melting elevation from 1956 in the old datum. I’m not sure when/if those signs will ever be changed. (The summit is 14,399.6ft +/-0.1ft in the NGVD29 datum).
I measured Columbia Crest melted down 1.3ft since last August 2025 and is now 14,393.5ft NAVD88. I fit several trend lines between the data points. The trend line between 1999 (when melting approximately started) and 2026 has a slope -0.9ft/year (R squared value 0.99). But the trend line between 2022-2026 has a slope -1.35 ft/yr (R squared value 0.993). So it appears the melting has been accelerating in recent years. The elevation loss per year has accelerated by 50%. It has now melted down 24ft since 1999.

Comparison of Liberty Cap from 1998 to 2026
In 2025 my team used ground penetrating radar to find the ice depth at the summit and thus the elevation of the ground beneath Columbia Crest. After Dr. McGrath reanalyzed that data recently, we found the ground is at an elevation 14,362ft. Thus, Columbia Crest currently has an ice thickness about 31ft. If melting continues at the current rate, it will melt to rock by 2049. But if melting accelerates, as it already has, it will melt to ground before 2049. I would estimate it will melt to rock within 20 years.

Liberty Cap elevations over time
Liberty Cap had an elevation between 14095ft – 14098ft, depending on if the bottom of the penitente is counted or the top. This is within error bounds of the same elevation as 2025. Though, it is challenging to measure an accurate number in a field of penitentes. More signifcant change would need to happen to be detected on that kind of summit.

Liberty Cap ice summit and rock summit, with measured ground location shown beneath ice summit
In 2025, when penitentes were less, my team used ground penetrating radar to measure the ground beneath the summit is at elevation 14060ft. I fit a trend line to the data between 2007 (when melting down approximately started) and 2026, and got a slope of -1.5ft/year. The nearby rock summit is at an elevation 14069.4ft. Thus, if current trends continue Liberty Cap will lose ice capped peak status by around 2042 (ice summit will be lower than rock summit) and by 2049 will melt to rock.
Temperature

Measured temperature at 14,200ft near the summit
I analyzed the temperature data and found 29 days between June 13 – Aug 20 had a high temperature above freezing. That represents 42% of days being above freezing. In this time period 255 hours were above freezing, representing 16% of the time. The highest temperature was 41F on August 6, and the lowest temperature was 9F on June 27. The mean temperature for the period measured was 25F.
Note: temperature loggers were placed at 14,200ft, about 200ft below the summit. The summit would likely be about 0.7F colder, assuming a standard lapse rate of 3.6F/1000ft. For results, I’m being conservative and reporting results from the cooler of the two temperature loggers (summit 2), and not including an apparent outlier point on June 23.
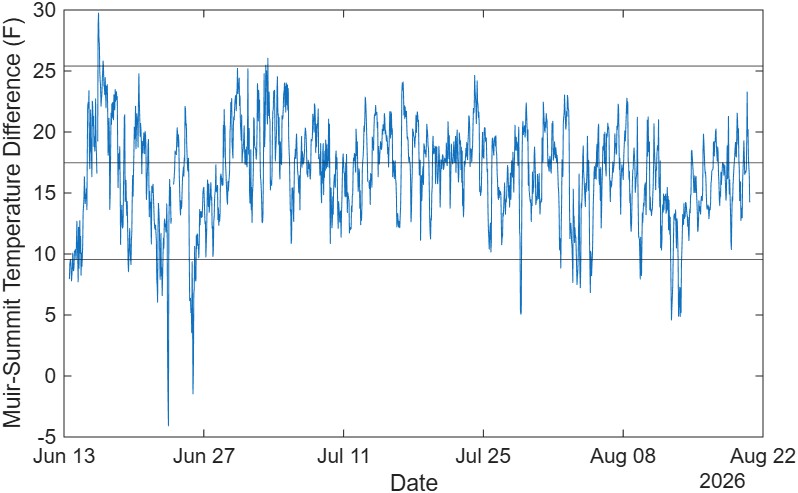
Difference between Camp Muir temperature and measured summit temperature. Horizontal lines shown at mean and +/-2 sigma from mean.
I next compared the data to the Camp Muir temperature data during the same period. The mean difference between the summit temperature and Camp Muir was 16.6F, with standard deviation 4F. This means a good estimate of summit temperature could be found by subtracting 16.6F from the Camp Muir temperature, with 95% confidence interval error +/-8F (2 sigma). This is pretty close to what would be expected if the standard lapse rate of 3.6F per 1000ft is assumed. That would result in the summit being 15.5F colder than Camp Muir.

UW Mount Rainier Recreation Forecast temperature plotted with measured summit temperature
I then compared the measured summit temperature to the temperatures predicted by the UW Mount Rainier Recreation Forecast. In general the UW forecast tends to smooth out and underpredict the summit temperature. The mean error between the UW predicted daily high and actual daily high was -6.4F, meaning the actual temperature is 6.4F warmer than the predicted temperature. This error had a standard deviation of 5F, so there is a lot of variability.
Interestingly, the hottest day of the UW forecast was 38F on Aug 6, which was close to the hottest measured temperature of 41F, also on Aug 6. The coldest predicted temperature was 7F on June 27, which was very close to the coldest measured temperature 9F also on June 27.

Error in UW forecasted summit temperature
The UW forecast predicted only 9 days at or above freezing, many fewer than the actual number of days, 29. Interestingly, the UW forecast sometimes has a freezing level above 14,500ft, but forecast summit temperature below freezing. During the period June 13-Aug 20 there were 18 days with predicted freezing levels above summit level. So it appears the forecast freezing level is a more accurate metric for climbers to use than the forecast summit temperature (unless the forecast model gets updated with this data in the future).
One final way to look at the results is in terms of a unit called “degree-days above freezing.” The units are days*C, using degrees celcius, meaning one day reaching a high of 1C is 1 day*C, and one day reaching a high of 2C is 2 day*C. The total number of measured degree days above 0C for the measured time period was 60.8 degree-days. This is already a greater number than we modeled for any year prior to 2017 (Fig 1) (Gilbertson 2025), and the measured period only includes 2/3 of the 2026 summer season. If the last month of this summer season is similarly warm, summer 2026 could get around 90 degree-days above freezing. That would make it warmer than all other modeled summers except 2020 and 2021 (though 2025 was not modeled). This data is thus consistent with the trend of the summit warming over time.
Discussion

Fig 1: Modeled degree-days above freezing on Mt Rainier 1950-2024
Temperatures on Mt Rainier have been measured to reach above freezing on a signifant number of days in the summer of 2026, nearly half of all summer days so far. This result is consistent with temperature modeling showing a significant number of above-freezing days every summer since at least the year 2000, with degree days above freezing increasing over time. This increase in degree-days above freezing is synchronous with increased and accelerating elevation loss of Columbia Crest. I would thus conclude with high confidence that Columbia Crest is losing elevation due to melting as a result of human-caused climate change.
A second possibility for the elevation loss has been proposed, that winter snow accumulation has been decreasing. We have previously shown that there is no significant long-term change in water-year precipitation in the cascade mountain west between 1950-2024. See Figure 2.

Fig 2: Modeled precipitation and temperature in the cascade mountain west
Additionally, I have measured that snow accumulation change is extremely unlikely to be the driver for the loss on Columbia Crest. I measured winter accumulations on Columbia Crest from 2024-2025 were only 0.5ft, and winter accumulations from 2025-2026 were only 1.3ft, though of course significantly more snow than this actually falls on the summit. For instance, Paradise, at the base of Mt Rainier, receives over 50ft of snow every year.
Likely, nearly all of the snow that falls on Columbia Crest gets blown off by the near-constant winds, with the accumulation being mostly rime. Thus, with minimal accumulation and increasing above freezing temperatures on the summit, melting now exceeds accumulation. This is why Columbia Crest is shrinking.
Acknowledgements
We would like to thank Rainier National Park staff for assistance with permitting and planning. Trimble provided surveying equipment.
References
Beason, S. R., & Kenyon, T. R. (2026). Interpreting summit elevations on Mount Rainier: Contextualizing ice-surface change, bedrock elevation, and geodetic frameworks. Arctic, Antarctic, and Alpine Research, 58(1). https://doi.org/10.1080/15230430.2026.2675741
Gilbertson, E., Abatzoglou, J., Stanchak, K., Hotaling, S., “Rapid shrinking and loss of ice-capped summits in the western USA,” Arctic, Antarctic, and Alpine Research Journal, 2025. Link to article: https://www.tandfonline.com/doi/full/10.1080/15230430.2025.2572898
© 2026, egilbert@alum.mit.edu. All rights reserved.
You must be logged in to post a comment.